Monitor Symfony errors easily with Monolog and Elasticsearch

- How to set up Elasticsearch and Kibana with Debian 12
- Configuring Symfony applications to send logs to ELK
- The configuration of index patterns in Kibana
As a web developer, you are often faced with the challenge that errors get lost in some logs and are overlooked. But especially in order to maintain important search engine rankings, errors should not affect the user experience.
Many errors can already be identified in advance through good tests, but it can still happen that an error slips through the check. But once the error is in the productive application, it is even more important to be able to identify it quickly. In the following sections, we will show you how you can easily set up error monitoring with monolog and Elasticsearch (more precisely, the ELK stack) to monitor your Symfony application.
As a Symfony developer, you should already be familiar with the monolog package. With over 140 million installations, the package is very widespread and is also recommended by Symfony itself for logging. Elasticsearch and the ELK stack (consisting of Elasticsearch, Logstash and Kibana) should be familiar to system administrators.
Setup the monitoring
In order to be able to use the monitoring at all, we first have to set up the ELK stack. However, we only need Elasticsearch and Kibana from the ELK stack. We will therefore only install these two programmes. But it might make sense to install other packages like Filebeat and Logstash, if the instance is used for other services apart from Symfony. In the following tutorial we use the operating system Debian 12 (Bookworm), with other distributions or versions it is possible that certain contents are not available or commands do not work. In the tutorial, we only show the installation of a single Elasticsearch node; for larger installations and more fail-safety, a cluster should be considered.
System requirements
| Memory | min. 8GB (64GB and more depending on the system) |
| CPU | min. 4 Cores |
| Disk | min. 50GB (for smaller environments), for larger environments SSDs should be used for better I/O performance |
Installation and configuration of Elasticsearch
Before you can start the installation, you should update the system:
apt update
apt upgrade
In order to install Elasticsearch, we need to add the Elastic repository. To do this, the GPG key of Elasticsearch must first be imported, then the repository must be added:
apt install curl gnupg2 -ycurl -sL https://artifacts.elastic.co/GPG-KEY-elasticsearch | gpg --dearmor > /etc/apt/trusted.gpg.d/elastic.gpgecho "deb https://artifacts.elastic.co/packages/7.x/apt stable main" | tee /etc/apt/sources.list.d/elastic-7.x.listNow Elasticsearch can be easily installed via apt after reloading the repositories with apt update:
apt updateapt install elasticsearchAfter the installation, a few configurations have to be made so that data can be sent to Elasticsearch.
For this purpose, the following configuration can be adopted in the file /etc/elasticsearch/elasticsearch.yml:
cluster.name: <clustername of application>
network.host: <host-address of server>
http.port: 9200
bootstrap.memory_lock: true
discovery.type: single-node
Parts of this configuration may already exist, in that case you can simply overwrite the lines.
But what exactly do the individual values stand for?
- cluster.name: The name of the cluster (in our case our instance) as an identifier (you are free to choose the name)
- network.host: The network address of the server so that Elasticsearch can be reached via it. Normally, Elasticsearch only starts on the localhost (127.0.0.1)
- http.port: By explicitly setting the port, we prevent Elasticsearch from selecting the first free port starting from 9200. This ensures that the port is reliably set to 9200.
- bootstrap.memory_lock: Prevents Elasticsearch from using SWAP and thus becoming slower
- discovery.type: In our case, sets the cluster to the single-node type, as we do not want to integrate any additional servers into the cluster.
Then we can activate Elasticsearch as a service and get it ready to go:
service enable --now elasticsearch
To check if Elasticsearch is running, we can query the status with service status elasticsearch.
To check completely, we can now navigate to the interface at http://ip-address:9200. The output there should look similar to the one here:
{
  "name" : "debian12",
  "cluster_name" : "syntaxphoenix-demo",
  "cluster_uuid" : "HJhGJdjbTAWXku4prm2bZQ",
  "version" : {
    "number" : "7.14.0",
    "build_flavor" : "default",
    "build_type" : "deb",
    "build_hash" : "dd5a0a2acaa2045ff9624f3729fc8a6f40835aa1",
    "build_date" : "2021-07-29T20:49:32.864135063Z",
    "build_snapshot" : false,
    "lucene_version" : "8.9.0",
    "minimum_wire_compatibility_version" : "6.8.0",
    "minimum_index_compatibility_version" : "6.0.0-beta1"
  },
  "tagline" : "You Know, for Search"
}
Installation and configuration of Kibana
To be able to view our collected errors, we need Kibana. In our example, we install Kibana on the same server as Elasticsearch. In theory, however, you can also install Kibana on its own instance.
To install Kibana, we first have to install the package via apt with the following command:
apt install kibana
By default, Kibana runs on 127.0.0.1:5601,
so we change the address to our reachable address of the server. For both services, however, it is recommended to set an nginx or haproxy as a proxy in front of it. Also to encrypt the traffic via SSL.
For Kibana, we therefore make the following changes in /etc/kibana/kibana.yml:
server.host: "<host-address of the server>"
elasticsearch.hosts: ["http://<host-address of the server>:9200"]
Kibana now only needs to be activated as a service like Elasticsearch, for this we need to use the following command:
service enable --now kibana
If a firewall such as ufw is installed, the ports for Elasticsearch and Kibana must be opened accordingly.
Afterwards, if we go to http://<address of our server>:5601, we should see the following:
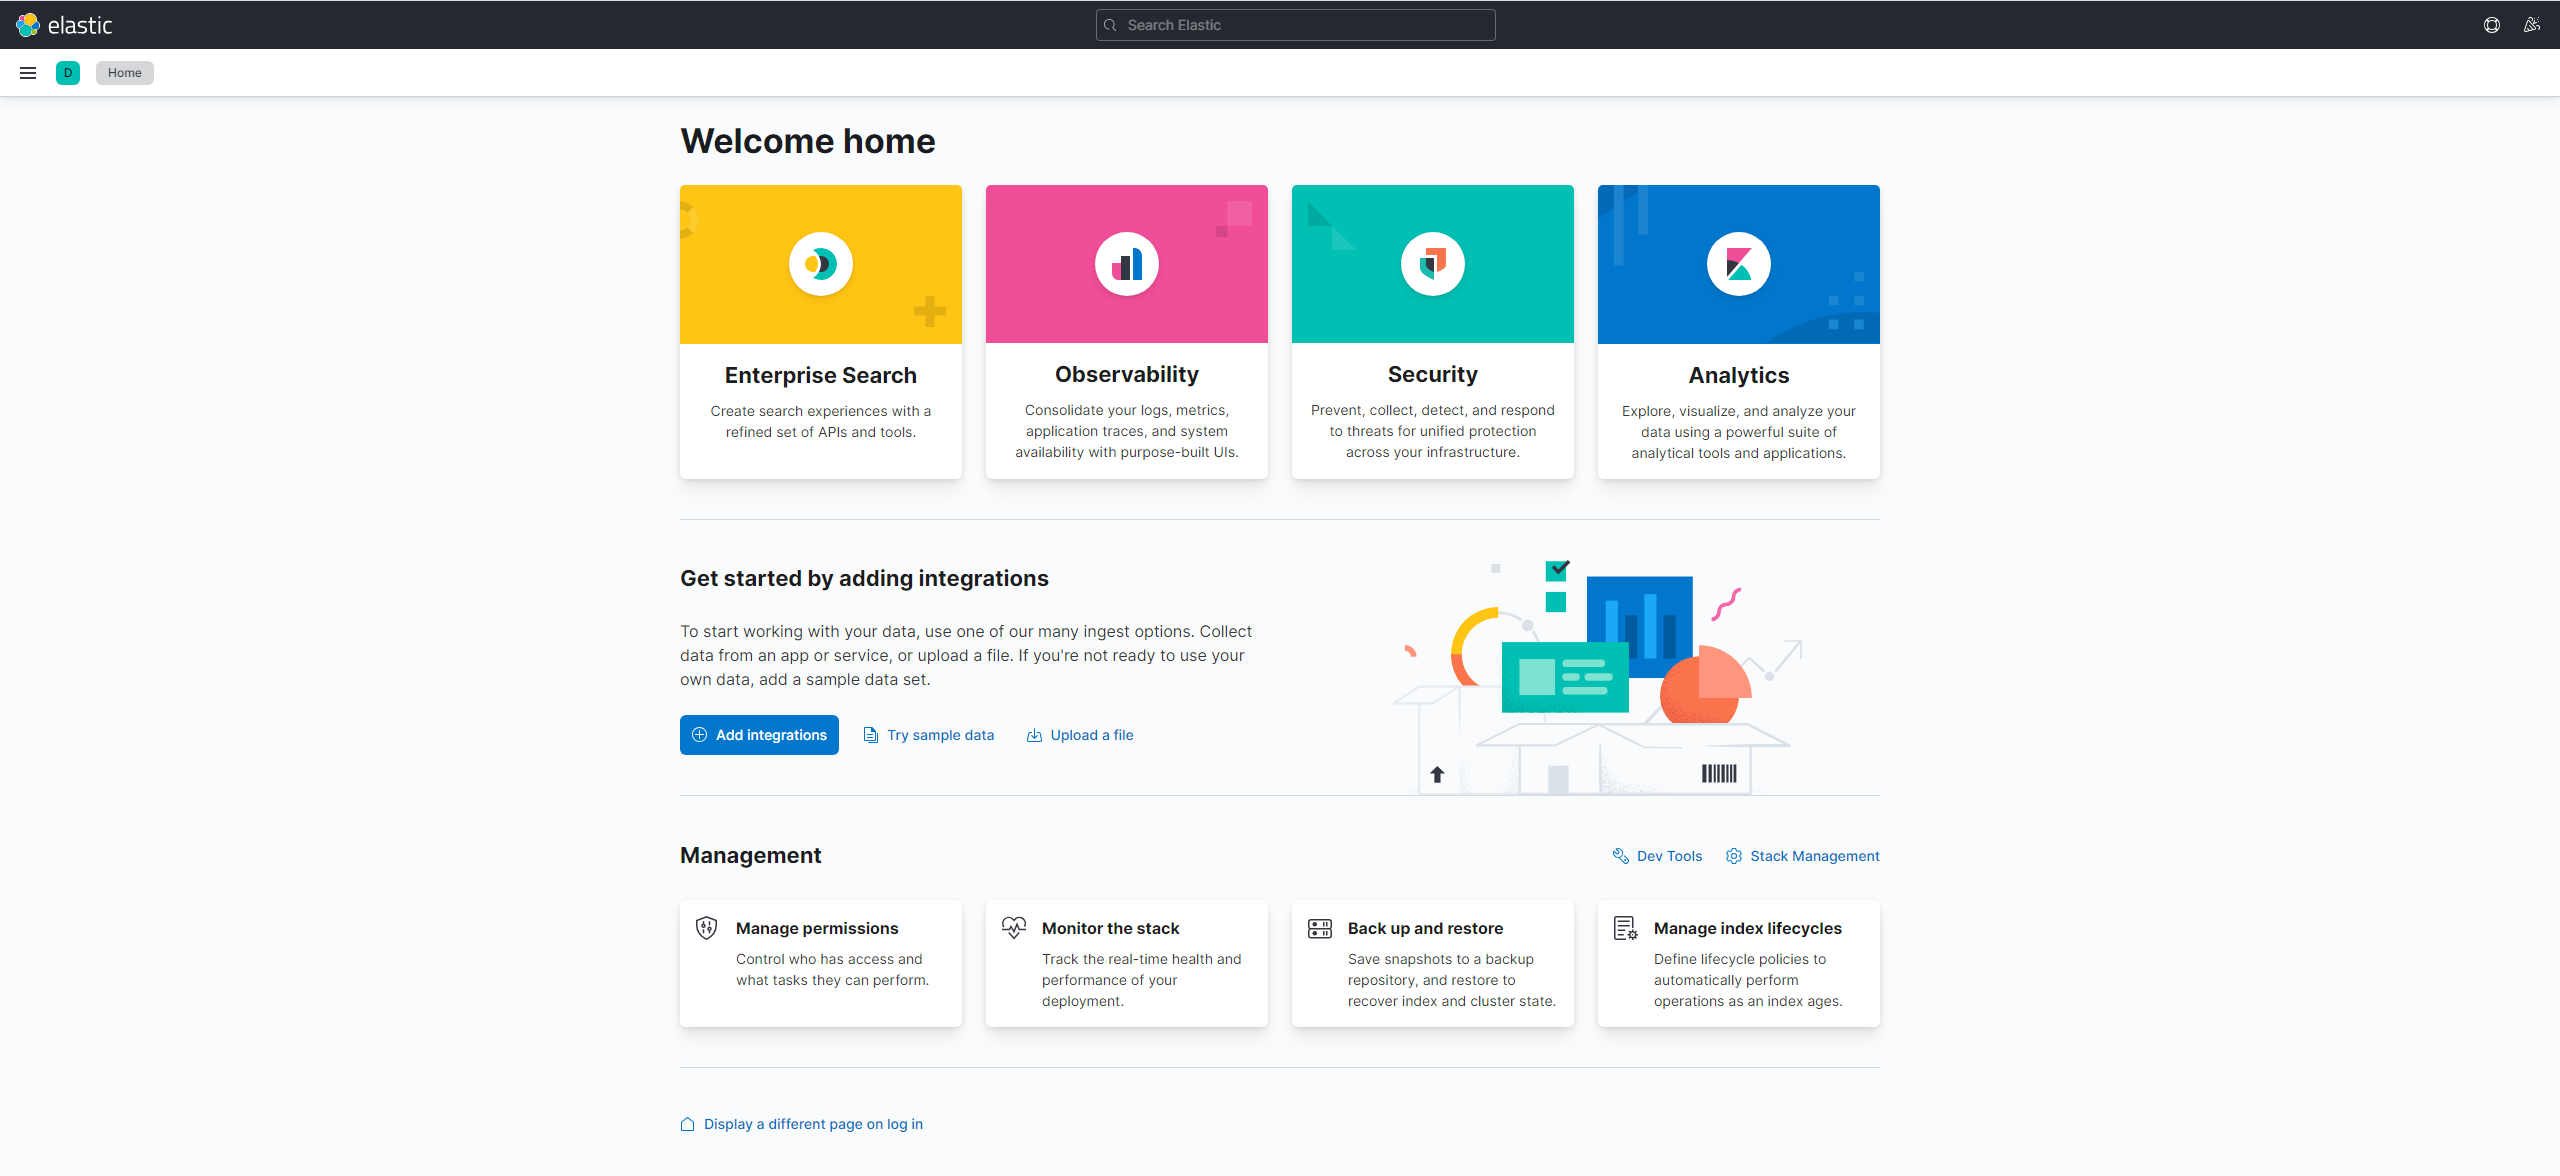
Now our server with Elasticsearch and Kibana is successfully set up and we can start with the configuration within our Symfony application accordingly.
Configuration of the Symfony application
Within the Symfony application, we only need to make a few adjustments so that we can communicate with Elasticsearch.
First we have to make sure that monolog or the monolog-bundle is installed and otherwise install it with composer:
composer install "symfony/monolog-bundle"
Then we can configure the ElasticsearchLogstashHandler. This sends our logs directly to Elasticsearch and formats them like Logstash.
To do this, we must first store the service in the services.yaml of our application:
    Symfony\Bridge\Monolog\Handler\ElasticsearchLogstashHandler:
        arguments:
            $endpoint: '%env(ELK_ENDPOINT)%'
            $index: "<name of our application>"
            $client: null
            $bubble: true
We store the name of our application as an index so that we can search for it later. In our case, for example, syntaxphoenix-homepage. We set the end point to the variable ELK_ENDPOINT, which is configurable via the .env file. This is helpful to be able to use a different ELK stack instance on test servers so that the production logs are not mixed with test logs.
In the .env file, the line would then look like the following:
ELK_ENDPOINT=<address of the elasticsearch-instance incl. used protocol>The address could then be e.g. https://elk-prod.yourwebsite.com.
In order to configure monolog correctly, we have to put the ELK handler there as well. Normally, we should only want to save logs when we have built the application productively (for test server and productive server). Therefore, we create the monolog.yaml in the directory /config/packages/prod. To prevent the application from being slowed down by the requests and sending all data to Elasticsearch only once per request, a finger-crossed handler or a buffer handler should be used before the ElasticsearchLogstashHandler. We use the first option in this case:
monolog:
    handlers:
        logfile:
            type:  rotating_file
            path: "%kernel.logs_dir%/%kernel.environment%.log"
            level: debug
            max_files: 14
        main:
            type: fingers_crossed
            level: debug
            channels: ["!event"]
            handler: elklogger
            action_level: error
            excluded_http_codes: [404, 405]
            buffer_size: 50
        elklogger:
            type: service
            id: Symfony\Bridge\Monolog\Handler\ElasticsearchLogstashHandler
In our configuration, we also use a rotating log file so that logs can also be accessed via the server's directories in an emergency, if there are problems with Elasticsearch. In addition, we only send all logs of a request if there is a log entry with level ERROR. This can be adjusted under action_level in the fingers_crossed handler. However, all normal requests without the corresponding action level are still stored in the log files.
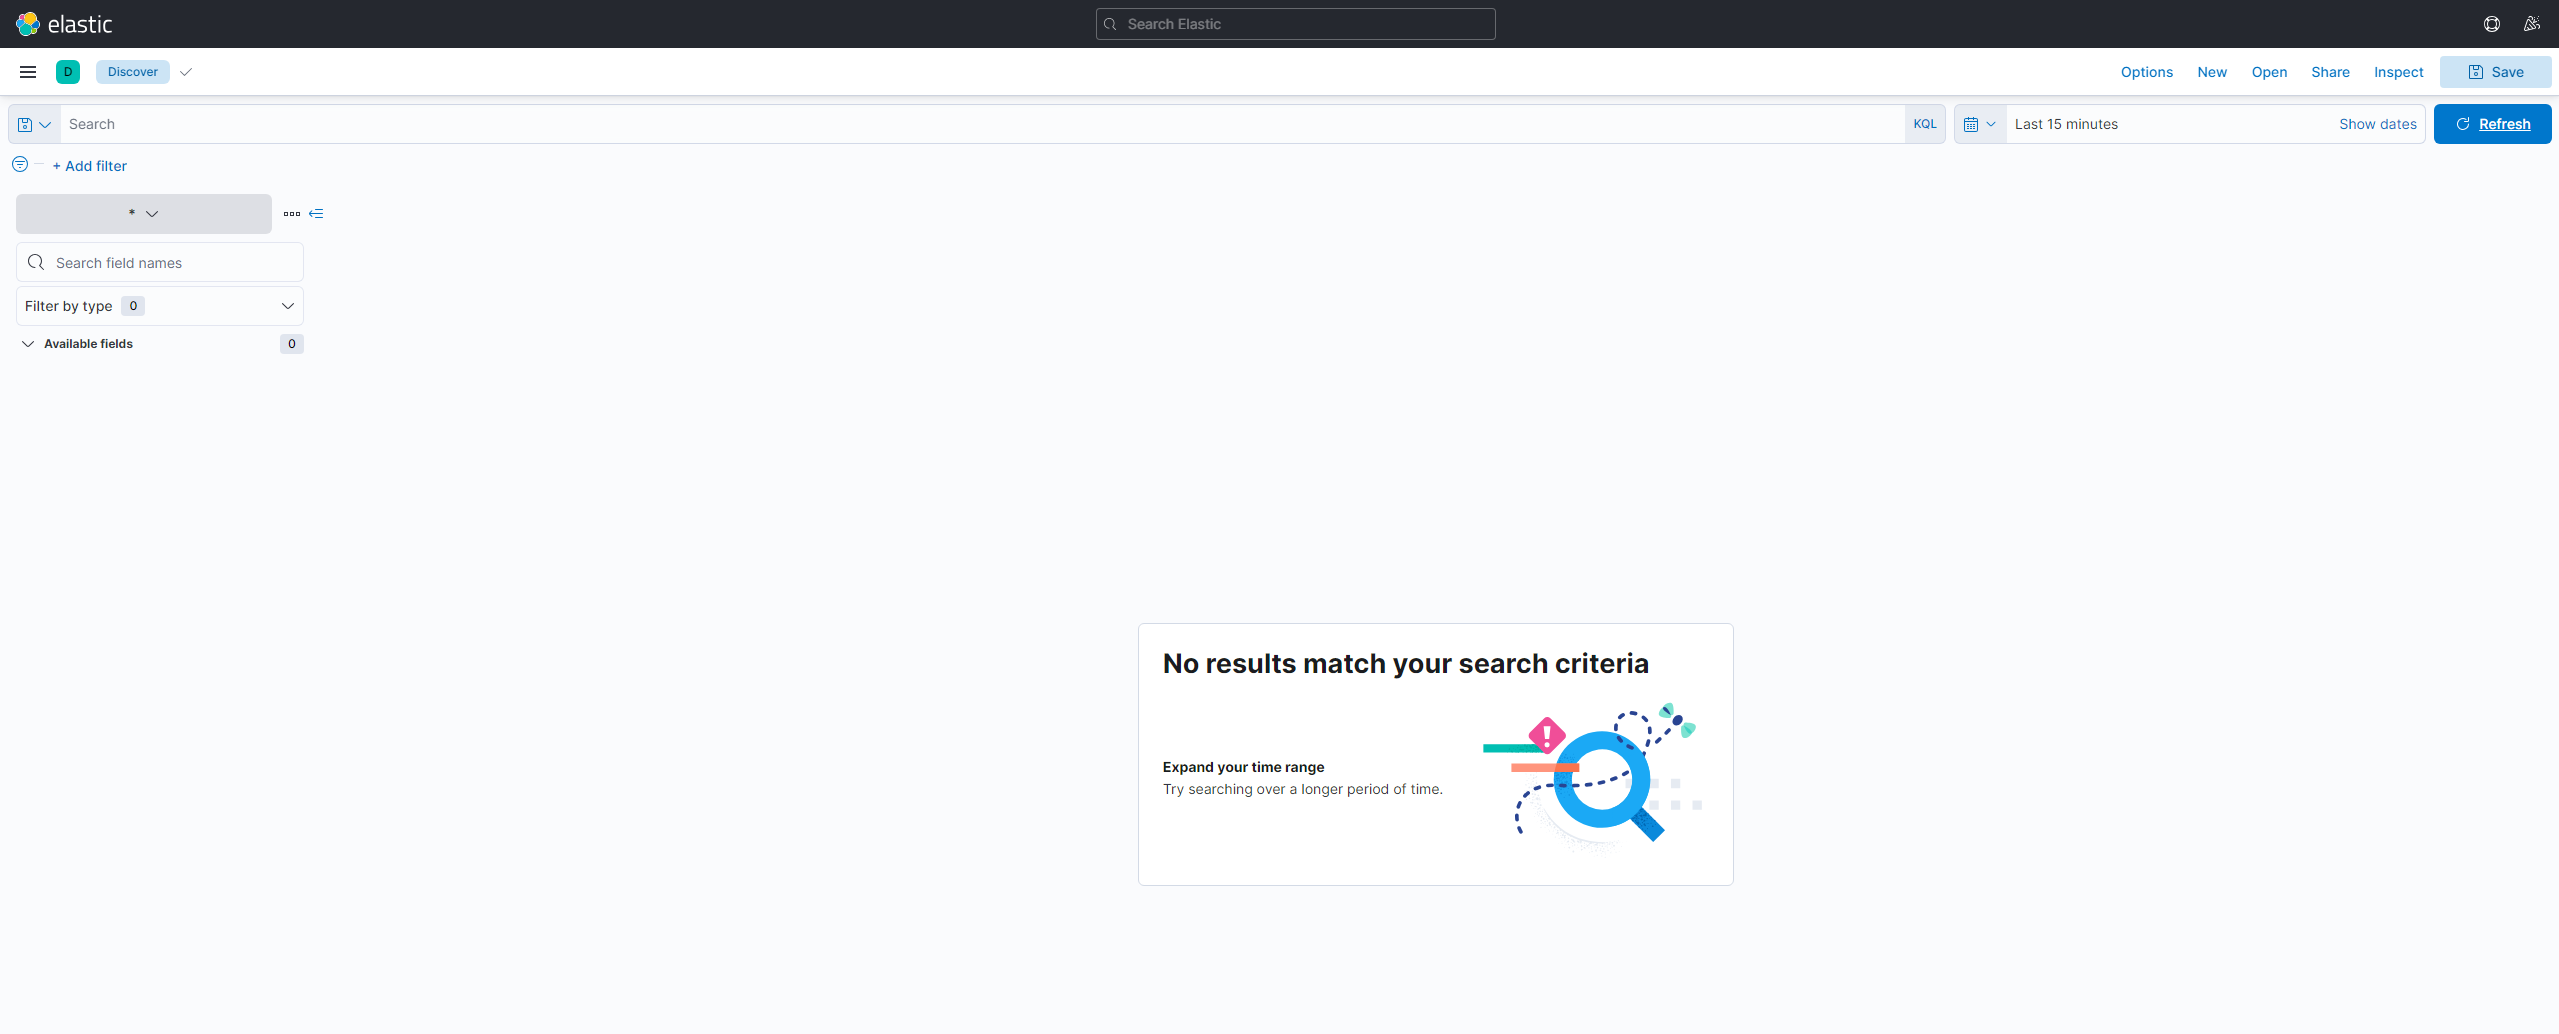
The configuration of our application for Elasticsearch is now complete. Now we can navigate to the Discover page (Under the Analytics tab) in Kibana via the Burger menu on the left hand side. The page should look like this:
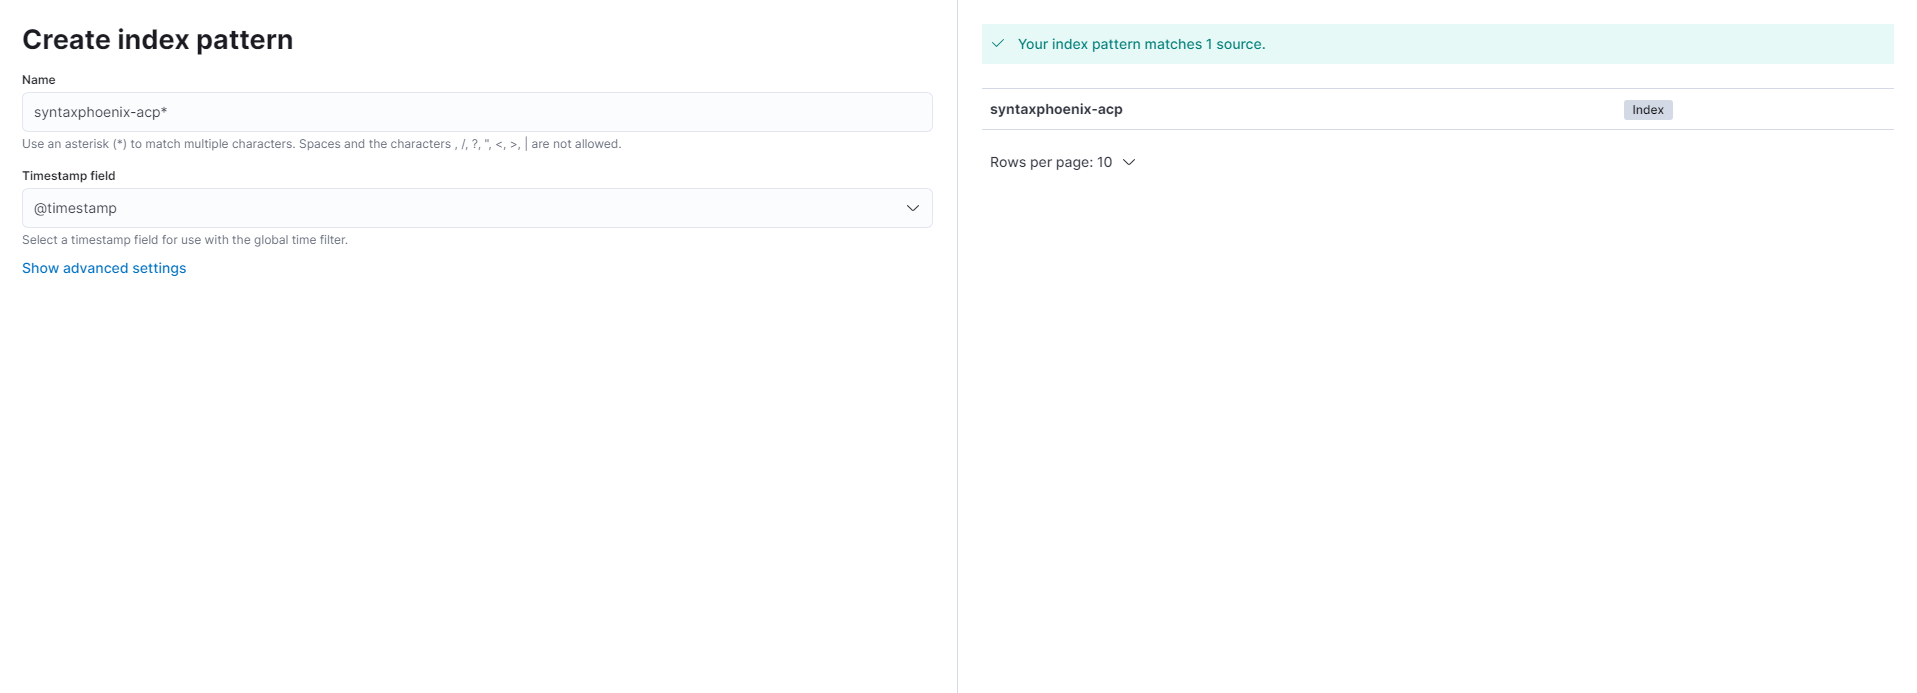
In order to be able to find entries, we have to specify so-called index patterns. These correspond to the value we specified in our services.yaml for $index in the ElasticsearchLogstashHandler. We can configure index patterns under <Kibana-Url>/app/management/kibana/indexPatterns. Here we can create a pattern using the Create index pattern button. All patterns should end with an asterisk (*). The field @timestamp can be selected as the timestamp field. If the pattern does not yet exist, but data for it is available, it can be created now.
Now we can look at our logs via Discover. We can now select our chosen index pattern as the index pattern. If all applications should be displayed at the same time, this can be realised by creating the index pattern *. This way all index patterns are loaded via wildcard.